Rabu, 17 Desember 2008

WMS software - watershed modeling

WMS software - watershed modeling
The Watershed Modeling System or WMS software is a comprehensive graphical modeling environment for all phases of watershed hydrology and hydraulics. The WMS software includes powerful tools to automate modeling processes such as automated basin delineation, geometric parameter calculations, GIS overlay computations (CN, rainfall depth, roughness coefficients, etc.), cross-section extraction from terrain data, and many more! With the release of the WMS software version 8, hydrologic modeling with HEC-1 (HEC-HMS), TR-20, TR-55, Rational Method, NFF, MODRAT, and HSPF is now supported. Hydraulic models now supported in the WMS software include HEC-RAS and CE QUAL W2. 2D integrated hydrology (including channel hydraulics and groundwater interaction) can now be modeled with GSSHA. All of this in a GIS-based data processing framework will make the task of watershed modeling and mapping easier than ever before.
The WMS software's modular design enables the user to select modules in custom combinations, allowing the user to choose only those hydrologic modeling capabilities that are required. Additional WMS software modules can be purchased and added at any time. The WMS software will dynamically link to these subsequent modules at run time—automatically adding additional modeling capability to the software.
Read More..

WinTopo Pro

WinTopo Pro: raster to vector conversion software
WinTopo Pro is a high quality raster to vector conversion software tool. WinTopo Pro converts raster images from scanners and other digital sources into vector data suitable for CAD, GIS and CNC systems. You can scan raster images such as old plans, archive drawings, or even photos, and convert them into useful vector CAD data. Any raster image which is stored in TIFF, GIF, JPEG, PNG or BMP format can be converted by WinTopo Pro into DXF and other vector file formats.
Read More..

WinFlow and WinTran

inFlow and WinTran
WinFlow is an interactive, analytical model that simulates two-dimensional steady-state and transient ground-water flow with wells, uniform recharge, circular recharge/discharge areas, and line sources or sinks. The model depicts the flow field using streamlines, particle traces, and water-level contours. WinTran couples the steady-state groundwater flow model from WinFlow with a contaminant transport model.

* WinFlow
* WinTran

WinFlow overview

WinFlow is an interactive, analytical model that simulates two-dimensional steady-state and transient ground-water flow (both confined and unconfined aquifers) with wells, uniform recharge, circular recharge/discharge areas, and line sources or sinks. The model depicts the flow field using streamlines, particle traces, and water-level contours. WinFlow has the same basic capabilities as Geraghty & Miller's QuickFlow software, although many features are different or enhanced.

WinFlow simulates both steady-state and transient flow. The steady-state module simulates ground-water flow in a horizontal plane using analytical functions developed by Strack (1989). The transient module uses equations developed by Theis (1935) and by Hantush and Jacob (1955) for confined and leaky aquifers, respectively.

WinFlow is simple to use and highly interactive, allowing you to create an analytical model in minutes. The software features standard Windows pulldown menus and dialogs to facilitate the model design. Common menu selections and commands are also available on the toolbar. The entire WinFlow manual is available as on-line, context-sensitive help.

WinFlow produces report-quality graphics using any Windows device driver. Output may also be exported to a wide variety of file types, including SURFER, Geosoft, Spyglass, Windows Metafiles, and AutoCAD-compatible DXF files.

WinFlow features

Some of the key features include:

* Simulates both steady-state and transient flow in confined and unconfined aquifers
* Simulates effects of wells, linesinks, ponds, and recharge
* Imports map files in DXF format, QuickFlow format, or ModelCad format
* Simple data input
* Calibration targets and calculation of calibration statistics
* Double-click an element to edit
* Click and drag to reposition elements, streamlines, or particles
* Multiple models may be open at one time
* Cut, copy, and paste elements to/from the clipboard
* Maps may be printed using any Windows device driver
* Full context-sensitive help system (the entire manual is on-line)
* Drag-and-drop input files into the WinFlow window

WinTran
WinTran couples the steady-state groundwater flow model from WinFlow with a contaminant transport model. The transport model has the feel of an analytic model but is actually an embedded finite-element simulator. The finite-element transport model is constructed automatically by the software but displays numerical criteria (Peclet and Courant numbers) to allow the user to avoid numerical or mass balance problems.


WinTran- contaminant transport made easy

Contaminant mass may be injected or extracted using any of the analytic elements, including wells, ponds, and linesinks. In addition, constant concentration elements have been added. WinTran displays both head and concentration contours and concentration may be plotted versus time at selected monitoring locations. The transport model includes the effects of dispersion, linear sorption (retardation), and first-order decay. Other features include:

* Simulates steady-state flow and transient transport in confined & unconfined aquifers
* Simulates effects of wells, linesinks, ponds, and constant concentration sources
* 32-bit software uses all memory available to Windows; Supports Windows V3.1 (with Win32s), NT, 9X, ME, 2000 and XP
* Displays Peclet and Courant criteria during transport simulation
* Displays mass balance error during simulation
* Contours concentration at user-specified time steps during simulation
* Velocities computed either analytically or using finite-element flow model
* Maps may be printed using any Windows device driver
* WYSIWYG printing with print preview and user-defined margins
* Full context-sensitive help system (the entire manual is on-line)
* All other features are the same as WinFlow (except transient flow model)
Read More..

WhiteStar

WhiteStar - high quality cartographic data: PLSS, DED, DOQQ, well headers, culture data and more
RockWare, Inc sells the following WhiteStar data products
(call 800 775 6745 for pricing and information):
Public Land Survey (PLSS)
Nationwide coverage. An accurate Public Land Survey base layer is the cornerstone for any GIS or mapping project. We offer Public Land Survey (also Known as PLSS, Digital Land Grid or Digitized Section, Township, and Range Information) at both the 1:100,000 scale and the 1:24,000 (USGS 7.5' map) resolution.

Texas Land Survey

Complete State of Texas Coverage. Digital land survey files are based on Texas Railroad Commission data. We offer two versions of the data: graphic - original data in useable format and intelligent - includes polygon attribute information. The following data products are offered:

* Texas Land Survey showing original blocks, surveys, abstracts, lots, tracts, subdivisions.
* Location and Statuses of Oil Wells (Well Location File).
* Basic Well Header Information.

National Well File (well headers)
The CartoBase National Well File consists of millions of well spots nationwide. The data works seamlessly with WhiteStar CartoBase Public Land Survey, Texas Land Survey, Enhanced Culture Databases, and Digital Elevation Models. Data attributes vary by state.

Enhanced County Cultures
Adds numerous map features to your products, including roads and water features. Each county file is a compilation of multiple data sources including the 1996 Census Bureau TIGER files. Each file contains hydrology, airports, city boundaries, above ground power lines, geographic names, geodetic survey benchmarks, highway symbols, "double lines + centerlines" for roads and highways, and much more.

Digital Elevation Data

Contours are available throughout the United States and around the world at various scales. Product includes elimination of systematic errors and available small scale Digital Elevation data. Please call us to verify your coverage area. The following data types are available:

* Digitized Contours - digitized from stable base (mylar) hard copy USGS base maps.
* Digital Elevation Models (DEM) - USGS DEMs created from photogrammetric data (1:24,000, 1:100,000, & 1:250,000 scale).

DOQQ and EDOQQ
A digital Orthophoto is a photograph that has been processed to have the same properties as map. In the image to the right, you can see how the image attaches seamlessly to the scanned topographic map. Additional data layers, such as the Texas Public Land Survey, can be overlain on top of a DOQQ to aid in interpretation of the imagery.
Read More..

WellCAD: Comprensive well log data management, analysis and visualization.

WellCAD Overview
WellCAD is a PC based composite log package, which combines comprehensive graphic editing mechanisms and data processing tools.

Combining technically excellent display, editing and analysis capabilities for well data, WellCAD has become the standard log composite software in the Mining, Oil / Gas and Geotechnical industries. WellCAD is used for a wide range of applications.


Read More..

Visual MODLOW 3D-Builder

Visual MODFLOW 3D-Builder
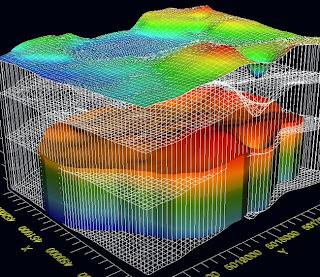
Visual MODFLOW 3D-Builder provides you with advanced capabilities for building conceptual models completely independent of the numerical grid and within a unified modeling environment.
Visual MODFLOW 3D-Builder is the new generation in dynamic conceptual model building. Featuring a powerful multi-format object/data import tool and tested to work within the latest version of the Visual MODFLOW modeling environment, Visual MODFLOW 3D-Builder enables you to build impressive representations of your groundwater system within a single modeling environment. This means you save hours when building your numerical model.

# Build a conceptual model of the groundwater system, prior to the simulation - The geological formations, property model, and boundary conditions are all designed outside the numerical grid; this allows the flexibility to adjust your interpretation of the groundwater system before applying the numerical grid and converting to a numerical model.
# Build the model with minimal data pre-processing required - Working with grid-independent data allows you to maximize the use of your existing GIS data and incorporate physical geology and geographic conditions before designing the grid.
# Generate and Simulate regional and local-scaled models - As the only MODFLOW GUI that supports MODFLOW 2005-LGR, users are now able to design local grids around the area of interest, directly within the 2D/3D conceptual model environment. Calculated heads from a regional model can also be used as boundary conditions for local-scaled models.
# Design the correct model faster - The grid-independent raw data is left intact and is not constricted by grid cells when modifying the data or project objective. This allows you to generate multiple numerical models from the same conceptual model.
# Make changes to the model data and immediately see results - The conceptual model environment provides simultaneous 2D/3D views which translates to automatically seeing the results whenever changes to the data are made.

Data Import
Import raw data from numerous formats and edit data to suit your modeling requirements. Visual MODFLOW 3D-Builder allows you edit xyz points, shapefiles, or wells as well as map or draw attributes for points, polylines, and polygons. You can also view meta-data including statistics and history or edit settings for changing colors and styles for boundary conditions, wells, points, property zones, labels, and position.Flexible Data Operations

Conduct several arithmetic or geometric calculations and easily apply them to the geometry of your data objects or attributes.

Viewing and Editing
View your work simultaneously in 2D, 3D or spreadsheet style and automatically edit your information. Visual MODFLOW 3D-Builder’s interactive multi-view display allows you to make changes to your data and display the results in all viewer windows all at once.

Define, Import, and Adjust Surfaces

Define surfaces from well tops, cross sections from Hydro GeoAnalyst, or by interpolating xyz points. Import surfaces from USGS .DEM, Surfer GRD, ESRI Ascii GRD. Manually adjust surfaces in 2d/3d or by editing your xyz points. Visual MODFLOW 3D-Builder delivers key features for:

* Loading well tops and creating surface coverage to represent formations
* Loading fence diagrams, cross-sections from Hydro GeoAnalyst, and interpolating contact points to create surfaces

Structure and Area Layers
Define the conceptual model area from a polygon and vertical horizons from surfaces. Several horizon types accommodate various geological conditions including pinchouts and discontinuous layers.

Property Zones
Use Shapefiles or CAD polygons/polylines to define property zones. Visual MODFLOW 3D-Builder supports several methods for defining property zone values, including: constant values, surfaces (2D Grid), and 3D Gridded Data.

Boundary Conditions
Define boundary geometry and attributes with Shapefiles or CAD polygons/polylines or by using the supported LAK and FHB packages.

Support for Horizontal Wells

Define values for entire zones, or use linear gradient. Methods for defining property zone values include:

* Constant value
* Surface (2D Grid) (eg river stage from DEM)
* 3D Gridded Data (recharge/evt)
* time schedule
* Shapefile attributes

Numerical Grid

Define multiple vertical discretizations including deformed, uniformed and semi-uniform

* Deformed - easy to design, requires a smaller number of layers
* Uniform (Rectilinear grid) - requires larger number of cells, but fully respects the finite-difference assumptions
* Semi-Uniformed - Top and bottom layers deform to the horizons; in between, a set of uniformly thick layers will be generated.

Translation to MODFLOW

Once your simulation model domain is defined, you can easily translate the conceptual objects to the simulation model grid and create the necessary MODFLOW input files. Visual MODFLOW 3D-Builder allows you to:

* Define multiple grid discretizations
* Define up to 9 child grids inside a parent grid with the built-in Local Grid refinement tool
* Translate as MODFLOW parameters (for use in PES)
* Select MODFLOW packages to represent boundary conditions (eg, model a river using MODFLOW RIV package or CHD package)
* Import MODFLOW files into Visual MODFLOW for running the simulation
Read More..

Visual MODFLOW Pro

Visual MODFLOW Pro Overview
With the ability to simulate groundwater and surface water interactions, and the added capability of calculating changes to groundwater chemistry, groundwater professionals now have a complete set of tools necessary for addressing water quality, groundwater supply, and source water protection initiatives.
MODFLOW-2000- World standard for groundwater flow simulations

MODFLOW-2005- three-dimensional finite-difference groundwater-model, 2005 version

MODPATH - standard package for forward and reverse particle tracking

Zone Budget - for sub-regional water budget calculations

MT3DMS - for multi-species contaminant transport simulations

MT3D99 - an enhanced version of MT3DMS, that includes support for implicit solver, TVD Solution scheme, dual-porosity advection-diffusion, Non-equilibrium Sorption and Monod Kinetics, and Multispecies Reactions, including First-Order Parent-Daughter chain reactions, and Instantaneous Reactions among species.

MNW (Multi-Node Well) - designed to help simulate wells with well screens that span multiple layers.

RT3D - for reactive transport simulations

PHT3D – a multi-component transport model for three-dimensional reactive transport in saturated porous media. It couples the two existing and widely used computer programs, the solute transport model MT3DMS and the USGS geochemical code PHREEQC-2

SEAWAT-2000 - the latest USGS modeling code designed to address three-dimensional, variable-density, transient groundwater flow conditions

MGO - for determining the optimal well pumping and/or injection rates at one or more wells, in order to achieve a specific objective while maintaining reasonable system responses

WinPEST - automated calibration and sensitivity analysis

GMG (Geometric Multi-Grid) Solver Integration - latest USGS solver designed to optimize memory usage and reduce model run times

Stream Routing Package - suited for simulating the effects of surface water/groundwater interactions

MIKE 11 - The basic river network/channel modeling component of MIKE 11 is now integrated, providing the tools for integrated surface water - groundwater flow

MODFLOW-SURFACT - Three-dimensional finite-difference variably-saturated flow or soil vapor flow simulations

With Visual MODFLOW Pro, you have all the tools necessary to:
* Graphically assign model grids, properties and boundaries
* Visualize model input parameters (2D or 3D views)
* Run the flow, pathline, and transport simulations
* Automatically (WinPEST) or manually calibrate the model
* Display and interpret the modeling results in full 3D
* Produce professional reports
Read More..

Visual MODFLOW Premium

Visual MODFLOW Premium overview
Visual MODFLOW Premium’s three-dimensional groundwater flow and contaminant transport modeling capabilities represents our most advanced combination of packages yet! Expanded groundwater simulation capabilities tackle the most challenging groundwater projects with ease thanks to this impressive new suite.
MODFLOW-2000 - world standard for groundwater flow simulations

MODFLOW-2005 - three-dimensional finite-difference groundwater-model, 2005 version

MODPATH - standard package for forward and reverse particle tracking

Zone Budget - for sub-regional water budget calculations

MT3DMS - for multi-species contaminant transport simulations

MT3D99 - an enhanced version of MT3DMS, that includes support for implicit solver, TVD Solution scheme, dual-porosity advection-diffusion, Non-equilibrium Sorption and Monod Kinetics, and Multispecies Reactions, including First-Order Parent-Daughter chain reactions, and Instantaneous Reactions among species.

MNW (Multi-Node Well) - designed to help simulate wells with well screens that span multiple layers.

RT3D - for reactive transport simulations

PHT3D – a multi-component transport model for three-dimensional reactive transport in saturated porous media. It couples the two existing and widely used computer programs, the solute transport model MT3DMS and the USGS geochemical code PHREEQC-2.

SEAWAT-2000- the latest USGS modeling code designed to address three-dimensional, variable-density, transient groundwater flow conditions

MGO - for determining the optimal well pumping and/or injection rates at one or more wells, in order to achieve a specific objective while maintaining reasonable system responses.

WinPEST - automated calibration and sensitivity analysis


GMG (Geometric Multi-Grid) Solver Integration - latest USGS solver designed to optimize memory usage and reduce model run times

SAMG (Systems Algebraic Multi-Grid) - an advanced solver ideally suited for large, complex models, now optimized to run with MODFLOW-2000 or SEAWAT-2000 projects

Stream Routing Package - suited for simulating the effects of surface water/groundwater interactions

MIKE11 - The basic river network/channel modeling component of MIKE 11 is now integrated, providing the tools for integrated surface water - groundwater flow.

MODFLOW-SURFACT - Three-dimensional finite-difference variably-saturated flow or soil vapor flow simulations

With Visual MODFLOW Premium, you have all the tools necessary to:
* Graphically assign model grids, properties and boundaries
* Visualize model input parameters (2D or 3D views)
* Run the flow, pathline, and transport simulations
* Automatically (WinPEST) or manually calibrate the model
* Display and interpret the modeling results in full 3D
* Produce professional reports
Read More..
Visual MODFLOW

Visual MODFLOW overview
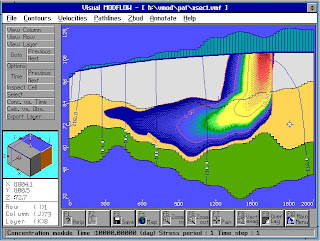
Visual MODFLOW is the proven standard for professional 3D groundwater flow and contaminant transport modeling software.

Visual MODFLOW's three-dimensional groundwater flow and contaminant transport modeling capabilities are trusted and used by more groundwater professionals than any other modeling software in the world thanks to several seamlessly integrated numeric engines with an easy-to-use graphical interface.

With the ability to simulate groundwater and surface water interactions and the added capability of calculating changes to groundwater chemistry, groundwater professionals now have a complete set of tools necessary for addressing water quality, groundwater supply, and source water protection initiatives.

MODFLOW-2000 - world standard for groundwater flow simulations

MODFLOW-2005 - three-dimensional finite-difference groundwater-model, 2005 version

MODPATH - standard package for forward and reverse particle tracking

Zone Budget - for sub-regional water budget calculations

MNW (Multi-Node Well) - designed to help simulate wells with well screens that span multiple layers

MT3DMS - for multi-species contaminant transport simulations

MT3D99 - an enhanced version of MT3DMS, that includes support for implicit solver, TVD Solution scheme, dual-porosity advection-diffusion, Non-equilibrium Sorption and Monod Kinetics, and Multispecies Reactions, including First-Order Parent-Daugher chain reactions, and Instantaneous Reactions among species

RT3D - for reactive transport simulations

Stream Routing Package - suited for simulating the effects of surface water/groundwater interactions

MODFLOW-SURFACT - three-dimensional finite-difference variably-saturated flow or soil vapor flow simulations

With Visual MODFLOW, you have all the tools necessary to:
* Graphically assign model grids, properties and boundaries
* Visualize model input parameters
* Run the flow, pathline, and transport simulations
* Manually calibrate the model
* Produce professional reports


Read More..

The Wonders of Rocks and Minerals

Overview
The Wonders of Rocks and Minerals explores the world of geology in an exciting and highly interactive way. What are minerals and how are they different from rocks? What are the three groups of rocks and the geological processes involved in the formation of each? You will learn to identify and name minerals and rocks, just like a geologist does on a field trip. Includes stunning photographs, full color animated sequences, interactive exercises, a glossary, and an illustrated database of over 50 minerals. Includes two levels of study: Elementary (grades 3-6) and Intermediate (grades 7-12).

A recommended resource to aid in training for the Science Olympiad Rocks and Minerals event.

Table of Contents

Minerals

* How are Minerals and Rocks Different?
* Important Mineral Properties
* How to Identify Minerals
* A Mineral Identification Key
* Important Mineral Groups
* Reviewing Minerals
* Basic Facts About Common Minerals

The Rock Cycle

Igneous Rocks

* How Igneous Rocks Form
* Textures of Igneous Rocks
* Minerals in Igneous Rocks
* Naming Igneous Rocks

Sedimentary Rocks

* How Sedimentary Rocks Form
* Conglomerate, Sandstone, and Shale
* Limestone, Chert, and Other Chemical Sedimentary Rocks
* Reviewing Sedimentary Rocks
* Interpreting Past Environments

Metamorphic Rocks

* Metamorphic Rocks are Changed Rocks
* What Causes Metamorphism?
* How Metamorphic Rocks are Different
* Common Metamorphic Rocks

The Rock Review Challenge

Written by Edward J. Tarbuck and Frederick K. Lutgens, Illinois Central College and Edward Greaney, Hunterdon Central Regional High School
Read More..
The Theory of Plate Tectonics

Overview
The Theory of Plate Tectonics shows you how volcanoes and mountain ranges are formed, what causes earthquakes, how the Earth's plates collide, and more. It includes full color animated sequences, stunning photographs, an illustrated glossary, a geologic timetable, review questions, and more. This CD-ROM includes three editions:

* English College edition version 1.1
* English High School edition version 1.1
* Spanish High School edition version 1.0

The College edition differs from the High School edition mainly with the addition of sections on Paleomagnetism, Sea Floor Spreading, Magnetic Reversals, and a Continental Drift Explorer. The High School edition has a section on Earth's Interior basics which is not in the College Edition.

Table of Contents

* The Earth's Interior
* Continental Drift
* Fit of the Continents
* Fossil Evidence
* Evidence from Rocks
* Paleoclimatic Evidence
* Continental Drift and Paleomagnetism
* Sea Floor Spreading
* Plate Tectonics
* Plate Boundaries
* Divergent Boundaries
* Convergent Boundaries
* Transform Fault Boundaries
* Testing the Plate Model
* Geomagnetic Reversals and Plate Tectonics
* Plate Tectonics and Earthquakes
* Hot Spots and Plate Tectonics
* The Driving Mechanism
* Plate Tectonics into the Future

Written by Edward J. Tarbuck, Illinois Central College
Read More..

Tasa Portfolios

Overview
For over 20 years, the developer of Tasa Portfolios has been producing high quality earth science illustrations for use in textbooks and workbooks as well as numerous software programs. Because of their educational value, the developer is making many of these illustrations available to educators for use in developing their earth science curriculum. The images appear in four volumes.

This unprecedented collection of earth science full color illustrations has just been updated! This unique artwork provides realistic representations of Earth's processes to supplement your lectures, labs, and activities. Each volume offers 100 llustrations covering different areas of study in the earth sciences. Each image is available in two sizes for use with your Macintosh or Windows operating system. Many of these illustrations are featured in Earth, 7th Edition by Edward J. Tarbuck and Frederick K. Lutgens, published by Prentice Hall.

* High resolution JPEG Format for Windows and Macintosh.
Sizes: 1024 x 768, 640 x 480
* Great for use with PowerPoint® presentations!
* Use in conjunction with the Tasa Photo CD-ROMs New
to create a dynamic presentation.
* Buy all four volumes for only $375.00.

Notice: These images are licensed only for personal use and/or for live, classroom presentations, so long as the user does not reproduce or use the graphics for pecuniary or other gain, in conjunction with any publication, or for any other purpose
Read More..

The Study of Minerals

The Study of Minerals
The Study of Minerals is a comprehensive learning tool for anyone interested in minerals, from a casual collector to the advanced mineralogy student. Learn about how crystals form, their symmetry, chemical composition, and properties. Find out what minerals are or go straight to microscopic and laboratory analysis of minerals. Study gems and ores, then test your skill at mineral exploration. Includes animated interactive activities, illustrated glossary, abundant photographs, video clips, and easy access to an extensive illustrated mineral properties database of over 150 minerals. Includes two college levels of study: Intermediate (Introduction to Minerals) and Advanced (Mineralogy).
Table of Contents

* Minerals, Crystals, and Rocks
* Mineral Symmetry - How Nature Builds Minerals
* Mineral Chemistry and Chemical Classification
* Physical Properties and Hand Sample ID
* Microscopic Analysis and Identification
* Laboratory Analysis and Identification
* Gemstones
* Mineral Exploration and Mining
* Mineral Database
* Illustrated Glossary


Written by M. Darby Dyar, Ph.D., Mount Holyoke College,
Richard M. Busch, Ph.D., and C. Gil Wiswall, Ph.D., West Chester University.

Read More..

Senin, 15 Desember 2008

Tasa Photo CD-ROMS: Rock Cycle I

Overview
The Tasa Photo CD-ROMS: Rock Cycle I collection is the result of an exhaustive hunt for a collection of photo CD-ROMs offering a variety of earth science photographs based on the National Science Education Standards to supplement your lectures, labs, and activities. The CD-ROM offers 100 photographs in two sizes for use with your Macintosh or Windows operating system.

The Minerals and Rock Cycle I Photo CD-ROMs are the first of several. Periodically check our web site for new products in the coming months.

* High resolution JPEG Format for Windows and Macintosh.
Sizes: 1024 x 768, 640 x 480
* Great for use with PowerPoint® presentations!
* Use in conjunction with the Tasa Portfolio CD-ROMs
to create a dynamic presentation.

Notice: These images are licensed only for personal use and/or for live, classroom presentations, so long as the user does not reproduce or use the graphics for pecuniary or other gain, in conjunction with any publication, or for any other purpose
Read More..

Tasa Photo CD-ROMS Minerals

Overview
The Tasa Photo CD-ROMS: Minerals collection is the result of an exhaustive hunt for a collection of photo CD-ROMs offering a variety of earth science photographs based on the National Science Education Standards to supplement your lectures, labs, and activities. The CD-ROM offers 100 photographs in two sizes for use with your Macintosh or Windows operating system.

The Minerals and Rock Cycle I Photo CD-ROMs are the first of several. Periodically check our web site for new products in the coming months.

* High resolution JPEG Format for Windows and Macintosh.
Sizes: 1024 x 768, 640 x 480
* Great for use with PowerPoint® presentations!
* Use in conjunction with the Tasa Portfolio CD-ROMs New
to create a dynamic presentation.

Notice: These images are licensed only for personal use and/or for live, classroom presentations, so long as the user does not reproduce or use the graphics for pecuniary or other gain, in conjunction with any publication, or for any other purpose
Read More..

Stereonet and rose diagram software

Stereonet and rose diagram software
RockWare StereoStat is an integrated platform for organizing, manipulating, visualizing and interpreting geological datasets. Functionality includes:

* Flexible and easy-to-user data importer
* Full color plotting
* Comprehensive data manipulation and organization
* Statistical analysis

RockWare StereoStat is must-have software for anyone who needs high quality rose diagram, stereo and tangent plots.
Read More..

RockWorks Utilities

RockWorks Utilities
An indispensible collection of mapping, modeling, analysis and display tools, now available as a stand-alone program. The RockWorks Utilities (also included in the full RockWorks package) provides geologists and engineers an amazing array of essential geotools, all for only $599!

Main program features

* Contour maps
* 3D surfaces and terrain models
* Gridding tools
* Solid modeling
* Volumetrics
* Piper diagrams, Stiff plots, Durov diagrams, and other hydrochemistry tools
* Stereonets
* Rose diagrams, and other structural geology tools

* Point and multivariate symbol maps
* Land grid maps
* 3D objects
* Ternary diagrams and other statistical tools
* Geotechnical tools
* Import/Export

Related Products

RockWorks: Project-wide management and interpolation of borehole data, with mapping, cross sections, fence diagrams, solid models, and much more. Shares data with LogPlot.

LogPlot 7: A companion package for generating detailed boring logs, well logs, mud logs, with almost unlimited flexibility in log layout. Shares data with RockWorks.

RockWorks GIS Link: Import your RockWorks borehole locations into ArcMap, and generate cross-sections, profiles and fence diagrams using ArcMap and RockWorks14.
Read More..

RockWorks

RockWorks
RockWorks is the latest version of RockWare's flagship software program. RockWorks has long been the standard in the petroleum, environmental, geotechnical and mining industries for subsurface data visualization because of popular tools such as maps, logs, cross sections, fence diagrams, solid models and volumetrics.

RockWorks offers numerous options for analyzing your subsurface data, and accepts many different data types, such as stratigraphy, lithology, downhole data, fracture data and hydrology and aquifer data.

In addition to its already impressive collection of existing capabilities, the latest RockWorks version has numerous new features, including an MDB borehole database, an interactive log designer, graphic editing tools, and much more.

RockWorks is extensively used in the following industries:
* Geotechnical
* Environmental
* Mining
* Petroleum

Related Products

RockWorks Utilities: A subset of the RockWorks program. Includes gridding, contouring, solid modeling, and general tools. (Does not include the borehole database manager.)

LogPlot 7: A companion package for generating detailed boring logs, well logs, mud logs, with almost unlimited flexibility in log layout. Shares data with RockWorks.

RockWare GIS Link 2: Import your RockWorks borehole locations into ArcMap, and generate cross-sections and profiles, fence diagrams, contour and isopach maps, and logs using ArcMap and RockWorks.
Read More..